INTRODUCTION
The search for the fountain of youth to make us look and feel younger has always been the talk of the town. While optimum nutrition is vital, it nowhere comes close to what you are going to read next. The secret to a long life is in how much you move. It is an exercise. Strength, endurance and flexibility go hand in hand for a better quality of life. This is how you embody ‘being fit’ in its truest sense.
Now picture this. It’s been a couple of months of hitting the gym consistently, lifting weights and wondering how fit you have got. Well, you do not need state-of-the-art machines to test fitness levels. Here are a few simple science-based tests that can reveal how fit you are.
CARDIOVASCULAR ENDURANCE TESTS
With cardio being an accurate indicator of how efficiently your body utilises oxygen, cardiovascular fitness remains the foundation of all health and fitness. If each time you step out for a brisk walk takes your breath away, then improving cardiovascular fitness should be the primary goal of any fitness program. Eliud Kipchoge, the world record holder who runs a full marathon (42.2 km) in just over 2 hours, has a VO2 max estimated at 80 ml/kg/min. VO2 max is the maximum amount of oxygen the body can use during physical activity. It is the most accurate predictor of a person’s cardiovascular fitness. The different methods to test yourself are as follows:
VO2 Max Fitness Ratings for Men
| Age (years) | ||||||
| Rating | 18 – 25 | 26 – 35 | 36 – 45 | 46 – 55 | 56 – 65 | 65+ |
| Excellent | > 60 | > 56 | > 51 | > 45 | > 41 | > 37 |
| Good | 52 – 60 | 49 – 56 | 43 – 51 | 39 – 45 | 36 – 41 | 33 – 37 |
| Above Average | 47 – 51 | 43 – 48 | 39 – 42 | 36 – 38 | 32 – 35 | 29 – 32 |
| Average | 42 – 46 | 40 – 42 | 35 – 38 | 32 – 35 | 30 – 31 | 26 – 28 |
| Below Average | 37 – 41 | 35 – 39 | 31 – 34 | 29 – 31 | 26 – 29 | 22 – 25 |
| Poor | 30 – 36 | 30 – 34 | 26 – 30 | 25 – 28 | 22 – 25 | 20 – 21 |
| Very Poor | < 30 | < 30 | < 26 | < 25 | < 22 | < 20 |
VO2 Max Fitness Ratings for Women
| Age (years) | ||||||
| Rating | 18 – 25 | 26 – 35 | 36 – 45 | 46 – 55 | 56 – 65 | 65+ |
| Excellent | > 56 | > 52 | > 45 | > 40 | > 37 | > 32 |
| Good | 47 – 52 | 45 – 52 | 38 – 45 | 34 – 40 | 32 – 37 | 28 – 32 |
| Above Average | 42 – 46 | 39 – 44 | 34 – 37 | 31 – 33 | 28 – 31 | 25 – 27 |
| Average | 38 – 41 | 35 – 38 | 31 – 33 | 28 – 30 | 25 – 27 | 22 – 24 |
| Below Average | 33 – 37 | 31 – 34 | 27 – 30 | 25 – 27 | 22 – 24 | 19 – 21 |
| Poor | 28 – 32 | 26 – 30 | 22 – 26 | 20 – 24 | 18 – 21 | 17 – 18 |
| Very Poor | < 28 | < 26 | < 22 | < 20 | < 18 | < 17 |
-
Multi-Stage Test
Commonly known as the beep test, it is used by schools, sports clubs, police and military forces to assess both aerobic capacity and cardiovascular endurance.
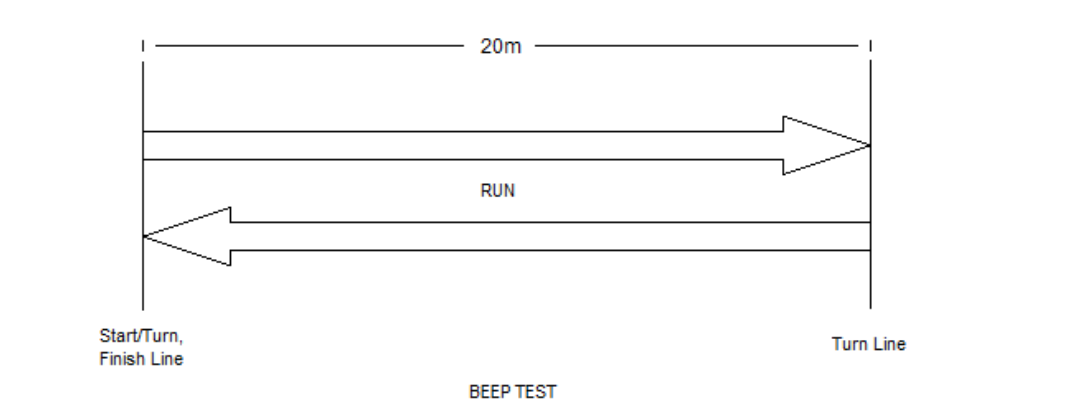
What You Will Need
- 20m of flat, straight, non-slip, runnable surface
- Beep Test audio file
- An assistant with recording sheets to keep track of the number of shuttles.
Test Procedure
- Participants must run back and forth along the 20m length in time with the beep.
- One foot must be placed on the 20m end or beyond in every shuttle.
- The time interval between each beep will shorten over time.
- If participants reach the end of the shuttle before the beep sounds, they must wait until the beep sounds and resume the shuttle.
- The test ends when the participant fails to reach the end line before the beep is sounded.
- The assistant records the number of shuttles completed by participants once they are withdrawn.
Standards for the Multistage (Beep) Fitness Test
This table exhibits the age-wise rating a participant’s Beep Test result falls into.
Each entry indicates Level/Shuttle (e.g., 3/3 = Level 3, Shuttle 3).
For Men
| Age | Very Poor | Poor | Fair | Average | Good | Very Good | Excellent |
| 12 – 13 | < 3/3 | 3/3 – 5/1 | 5/2 – 6/4 | 6/5 – 7/5 | 7/6 – 8/8 | 8/9 – 10/9 | > 10/9 |
| 14 – 15 | < 4/7 | 4/7 – 6/1 | 6/2 – 7/4 | 7/5 – 8/9 | 8/10 – 9/8 | 9/9 – 12/2 | > 12/2 |
| 16 – 17 | < 5/1 | 5/1 – 6/8 | 6/9 – 8/2 | 8/3 – 9/9 | 9/10 – 11/3 | 11/4 – -13/7 | > 13/7 |
| 18 – 25 | < 5/2 | 5/2 – 7/1 | 7/2 – 8/5 | 8/6 – 10/1 | 10/2 – 11/5 | 11/6 – 13/10 | > 13/10 |
| 26 – 35 | < 5/2 | 5/2 – 6/5 | 6/6 – 7/9 | 7/10 – 8/9 | 8/10 – 10/6 | 10/7 – 12/9 | > 12/9 |
| 36 – 45 | < 3/8 | 3/8 – 5/3 | 5/4 – 6/4 | 6/5 – 7/7 | 7/8 – 8/9 | 8/10 – 11/3 | > 11/3 |
| 46 – 55 | < 3/6 | 3/6 – 4/6 | 4/7 – 5/5 | 5/6 – 6/6 | 6/7 – 7/7 | 7/8 – 9/5 | > 9/5 |
| 56 – 65 | < 2/7 | 2/7 – 3/6 | 3/7 – 4/8 | 4/9 – 5/6 | 5/7 – 6/8 | 6/9 – 8/4 | > 8/4 |
| > 65 yrs | < 2/2 | 2/2 – 2/5 | 2/6 – 3/7 | 3/8- 4/8 | 4/9 – 6/1 | 6/2 – 7/2 | > 7/2 |
Women
| Age | Very Poor | Poor | Fair | Average | Good | Very Good | Excellent |
| 12 – 13 | < 2/6 | 2/6 – 3/5 | 3/6 – 5/1 | 5/2 – 6/1 | 6/2 – 7/4 | 7/5 – 9/3 | > 9/3 |
| 14 – 15 | < 3/3 | 3/3 – 5/2 | 5/3 – 6/4 | 6/5 – 7/5 | 7/6 – 8/7 | 8/8 – 10/7 | > 10/7 |
| 16 – 17 | < 4/2 | 4/2 – 5/6 | 5/7 -7/1 | 7/2 – 8/4 | 8/5 – 9/7 | 9/8 – 11/10 | > 11/10 |
| 18 – 25 | < 4/5 | 4/5 – 5/7 | 5/8 – 7/2 | 7/3 – 8/6 | 8/7 – 10/1 | 10/2 – 12/7 | >12/7 |
| 26 – 35 | < 3/8 | 3/8 – 5/2 | 5/3 – 6/5 | 6/6 – 7/7 | 7/8 – 9/4 | 9/5 – 11/5 | > 11/5 |
| 36 – 45 | < 2/7 | 2/7 – 3/7 | 3/8 – 5/3 | 5/4 – 6/2 | 6/3 – 7/4 | 7/5 – 9/5 | > 9/5 |
| 46 – 55 | < 2/5 | 2/5 – 3/5 | 3/6 – 4/4 | 4/5 – 5/3 | 5/4 – 6/2 | 6/3 – 8/1 | > 8/1 |
| 56 – 65 | < 2/2 | 2/2 – 2/6 | 2/7 – 3/5 | 3/6 – 4/4 | 4/5 – 5/6 | 5/7 – 7/2 | > 7/2 |
| > 65 yrs | < 1/5 | 1/5 – 2/1 | 2/2 – 2/6 | 2/7 – 3/4 | 3/5 – 4/3 | 4/4 – 5/7 | > 5/7 |
2. Cooper’s 12 Minute Run
Essential Requirements
- 400 metre track
- Stopwatch
- Assistant
- Whistle
Test Procedure
- Start with a brief warm-up to prepare the body for the actual test.
- Once the assistant sounds the whistle, the participant starts running as fast as possible to cover the longest distance.
- The remaining time may be communicated to the participant by the assistant after every lap.
- When 12 minutes have been completed, the run ends, and the assistant informs the participant of the total distance covered.
Standards For Men
| Age | Excellent | Above Average | Average | Below Average | Poor |
| 13 – 14 | > 2700m | 2400 – 2700m | 2200 – 2399m | 2100 – 2199m | < 2100m |
| 15 – 16 | > 2800m | 2500 – 2800m | 2300 – 2499m | 2200 – 2299m | < 2200m |
| 17 – 19 | > 3000m | 2700 – 3000m | 2500 – 2699m | 2300 – 2499m | < 2300m |
| 20 – 29 | > 2800m | 2400 – 2800m | 2200 – 2399m | 1600 – 2199m | < 1600m |
| 30 – 39 | >2700m | 2300 – 2700m | 1900 – 2299m | 1500 – 1999m | < 1500m |
| 40-49 | > 2500m | 2100 – 2500m | 1700 – 2099m | 1400 – 1699m | < 1400m |
| > 50 | > 2400m | 2000 – 2400m | 1600 – 1999m | 1300 – 1599m | < 1300m |
Standards for Women
| Age | Excellent | Above Average | Average | Below Average | Poor |
| 13 – 14 | > 2000m | 1900 – 2000m | 1600 – 1899m | 1500 – 1599m | < 1500m |
| 15 – 16 | > 2100m | 2000 – 2100m | 1700 – 1999m | 1600 – 1699m | < 1600m |
| 17 – 19 | > 2300m | 2100 – 2300m | 1800 – 2099m | 1700 – 1799m | < 1700m |
| 20 – 29 | > 2700m | 2200 – 2700m | 1800 – 2199m | 1500 – 1799m | < 1500m |
| 30 – 39 | > 2500m | 2000 – 2500m | 1700 – 1999m | 1400 – 1699m | < 1400m |
| 40-49 | > 2300m | 1900 – 2300m | 1500 – 1899m | 1200 – 1499m | < 1200m |
| > 50 | > 2200m | 1700 – 2200m | 1400 – 1699m | 1100 – 1399m | < 1100m |
-
YMCA 3-Minute Step Test
If going outdoors, finding a running track in your city, or relying on an assistant isn’t quite convenient for you, then the YMCA Step Test might just be the thing to test your cardiovascular fitness. With just 3 minutes to spare and a bench in your home, this test is quick and straightforward. The Bench Step Test measures Heart Rate Recovery (HRR) or how fast your heart and autonomic nervous system return to normal after an intense bout of exercise.
Essential Requirements
- Find a bench or a box that is approximately 12 inches in height.
- Stopwatch
- A 96 beats per minute Metronome
Test Procedure
- Position yourself facing the step.
- Start the metronome at a loud enough volume to be audible.
- Start the timer and step on and off the step in accordance with the metronome, with a cadence of up (left leg), up (right leg), down (left leg), down (right leg).
- Keep doing so for a total of 3 minutes.
- Stop at the end of 3 minutes and sit down on the step.
- Manually check your pulse reading and count the number of beats for 1 minute.
- Once the above step is done, find your score on the rating scale below.
Standards for Men Based on Age
| Age | 18 – 25 | 26 – 35 | 36 – 45 | 46 – 55 | 59 – 65 | 65+ |
| Excellent | 50 – 76 | 51 – 76 | 49 – 76 | 56 – 82 | 60 – 77 | 59 – 81 |
| Good | 79 – 84 | 79 – 85 | 80 – 88 | 87 – 93 | 86 – 94 | 87 – 92 |
| Above Average | 88 – 93 | 88 – 94 | 92 – 88 | 95 – 101 | 97 – 100 | 94 – 102 |
| Average | 95 – 100 | 96 – 102 | 100 – 105 | 103 – 111 | 103 – 109 | 104 – 110 |
| Below Average | 102 – 107 | 104 – 110 | 108- 113 | 113 – 119 | 111 – 117 | 114 – 118 |
| Poor | 111 – 119 | 114 – 121 | 116 – 124 | 121 – 126 | 119 – 128 | 121 – 126 |
| Very Poor | 124 – 157 | 126 – 161 | 130 – 163 | 131 – 159 | 131 – 154 | 130 – 151 |
Standards for Women Based on Age
| Age | 18 – 25 | 26 – 35 | 36 – 45 | 46 – 55 | 59 – 65 | 65+ |
| Excellent | 52 – 81 | 58 – 80 | 51 – 84 | 63 – 91 | 60 – 92 | 70 – 92 |
| Good | 85 – 93 | 85 – 92 | 89 – 96 | 95 – 101 | 97 – 103 | 96 – 101 |
| Above Average | 96 – 102 | 95 – 101 | 100 – 104 | 104 – 110 | 106 – 111 | 104 – 111 |
| Average | 104 – 110 | 104 – 110 | 107 – 112 | 113 – 118 | 113 – 118 | 116 – 121 |
| Below Average | 113 – 120 | 113 – 129 | 115 – 120 | 120 – 124 | 119 – 127 | 123 – 126 |
| Poor | 122 – 131 | 122 – 129 | 124 – 132 | 126 – 132 | 129 – 135 | 128 – 133 |
| Very Poor | 135 – 169 | 134 – 171 | 137 – 169 | 137 – 171 | 141 – 174 | 135 – 155 |
MUSCULOSKELETAL TESTS
These tests assess both the strength and flexibility of the muscular and skeletal systems. While these tests do not directly fit into many of the fitness assessments prevalent today, they still provide valuable insights to assist in goal setting and program design.
-
Sit and Reach Test
When was the last time you dropped something on the floor and you picked it up without bending your knees? As we age, we lose flexibility. One reason for this is the lack of activity. Muscles become stiff, and joint mobility suffers. Having flexible muscles has also been shown to reduce resting heart rate.
This test evaluates the flexibility of the lower back and hamstring muscles.
Test Procedure
- Sit on a flat surface, without footwear, with legs extended together in front of the body. Point the toes up and slightly apart with the soles flat on the base of a step or any flat surface.
- Place a ruler on the ground on the top of the step or between your feet.
- Without bending the knees, place one hand over the other and reach forward slowly.
- At the farthest point of reach, hold for a few seconds and measure it on the ruler for the distance covered beyond the base of your foot.
- If you could not touch your toes, then measure how far away you were from your toes. This will be a negative score.
Sit and Reach Norms
| Men | Women | |
| cm | cm | |
| Super | > +27 | > +30 |
| Excellent | +17 to +27 | +21 to +30 |
| Good | +6 to +16 | +11 to +20 |
| Average | 0 to +5 | +1 to +10 |
| Fair | -8 to -1 | -7 to 0 |
| Poor | -20 to -9 | -15 to -8 |
| Very Poor | < -20 | < -15 |
-
Push Up Test
Push-ups are among the first exercises one may have done at any age. Even to this day, this exercise remains part of numerous selection processes for military and law enforcement alike.
Test Procedure:
Men should adopt the ‘military style’ push-up position, with the arms close to the sides of the chest. Only the hands and the toes will be in contact with the ground. Women can use the ‘bent knee’ position with the chest touching the ground or with the elbows at right angles to the floor.
- The objective is to complete as many push-ups as possible until fatigue.
- Note the number of push-ups done and use the chart below to assess the participant.
Men
| Age | ||||||
| Rating | 17 – 19 | 20 – 29 | 30 – 39 | 40 – 49 | 50 – 59 | 60 – 65 |
| Excellent | > 56 | > 47 | > 41 | > 34 | > 31 | > 30 |
| Good | 47 – 56 | 39 – 47 | 34 – 41 | 28 -34 | 25 – 31 | 24 – 30 |
| Above Average | 35 – 46 | 30 – 39 | 25 – 33 | 21 – 28 | 18 – 24 | 17 – 23 |
| Average | 19 – 34 | 17 – 29 | 13 – 24 | 11 – 20 | 9 – 17 | 6 – 16 |
| Below Average | 11 – 18 | 10 – 16 | 8 – 12 | 6 – 10 | 5 – 8 | 3 – 5 |
| Poor | 4 – 10 | 4 – 9 | 2 – 7 | 1 – 5 | 1 – 4 | 1 – 2 |
| Very Poor | < 4 | < 4 | < 2 | 0 | 0 | 0 |
Women
| Age | ||||||
| Rating | 17 – 19 | 20 – 29 | 30 – 39 | 40 – 49 | 50 – 59 | 60 – 65 |
| Excellent | > 35 | > 36 | > 37 | > 31 | > 25 | > 23 |
| Good | 27 – 35 | 30 – 36 | 30 – 37 | 25 – 31 | 21 – 25 | 19 – 23 |
| Above Average | 21 – 27 | 23 – 29 | 22 – 30 | 18 – 24 | 15 – 20 | 13 – 18 |
| Average | 11 – 20 | 12 – 22 | 10 – 21 | 8 – 17 | 7 – 14 | 5 – |
| Below Average | 6 – 10 | 7 – 11 | 5 – 9 | 4 – 7 | 3 – 6 | 2 – 4 |
| Poor | 2 – 5 | 2 – 6 | 1 – 4 | 1 – 3 | 1 – 2 | 1 |
| Very Poor | 1 | 1 | 0 | 0 | 0 | 0 |
3. Squat Test
To this day, the squat remains as one of the most functional exercises one can use to build a solid lower body. Targeting your glutes, quads, hamstrings, and calves in one go makes the squat a complete lower-body workout.
Test Procedure:
- Position yourself in front of a chair, facing away from it.
- Feet must be shoulder-width apart.
- Now squat down to touch the chair, then stand back up.
- Repeat until exhaustion.
- Record the number of squats completed.
Men
| Age | |||||
| Rating | 20 – 29 | 30 – 39 | 40 – 49 | 50 – 59 | 60+ |
| Excellent | > 34 | > 32 | >29 | > 26 | > 23 |
| Good | 33 – 34 | 30 – 32 | 27 – 29 | 24 – 26 | 21 – 23 |
| Above Average | 30 – 32 | 27 – 29 | 24 – 26 | 21 – 23 | 18 – 20 |
| Average | 27 – 29 | 24 – 26 | 21 – 23 | 18 – 20 | 15 – 17 |
| Below Average | 24 – 26 | 21 – 23 | 18 – 20 | 15 – 17 | 12 – 14 |
| Poor | 21 – 23 | 18 – 20 | 15 – 17 | 12 – 14 | 9 – 11 |
| Very Poor | < 21 | < 18 | < 15 | < 12 | < 9 |
Women
| Age(years) | |||||
| Rating | 20 – 29 | 30 – 39 | 40 – 49 | 50 – 59 | 60+ |
| Excellent | > 29 | > 26 | > 23 | > 20 | > 17 |
| Good | 27 – 29 | 24 – 26 | 21 – 23 | 18 – 20 | 15 – 17 |
| Above Average | 24 – 26 | 21 – 23 | 18 – 20 | 15 – 17 | 12 – 14 |
| Average | 21 – 23 | 18 – 20 | 15 – 17 | 12 – 14 | 9 – 11 |
| Below Average | 18 – 20 | 15 – 17 | 12 – 14 | 9 – 11 | 6 – 8 |
| Poor | 15 – 17 | 12 – 14 | 9 – 11 | 6 – 8 | 3 – 5 |
| Very Poor | < 15 | < 12 | < 9 | < 6 | < 3 |
KEY TAKEAWAY
As human beings who want to contribute to the well-being of our immediate loved ones, knowing where we are on our fitness journey is the first step toward building a healthier, upgraded version of ourselves. The numbers on these charts offer valuable insight into how your metabolic age can be influenced by lifestyle and everyday choices. Living a healthier lifestyle with a regular dose of exercise and proper nutrition is, in itself, the secret to having a lower metabolic age than your chronological age. Effort is the driver of all rewards. It promises to take you to destinations and a mentality that previously never existed in your reality. So quit procrastinating the obvious and take action to live a healthier, wealthier and wiser life.